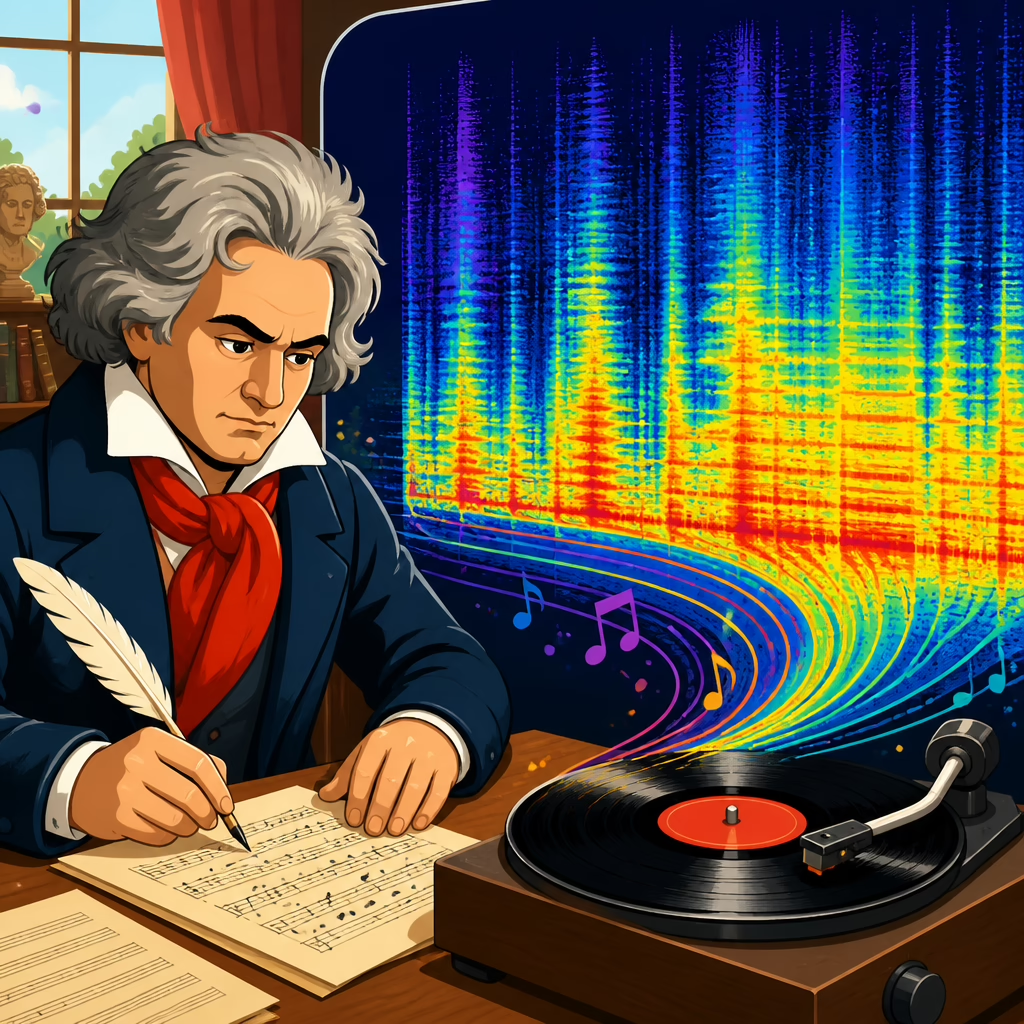
What Spectrograms Reveal in Beethoven Recordings
Spectrograms make Beethoven recordings visible, turning fleeting sound into a time-and-frequency map that exposes details the ear senses but cannot easily measure. In a spectrogram, time runs horizontally, frequency runs vertically, and color or brightness indicates energy. That simple framework lets engineers, performers, and listeners examine articulation, pedaling, vibrato, room resonance, tape noise, and even restoration choices in historic transfers. For Beethoven recordings, the method matters because his music depends on sharply profiled dynamics, rhythmic attack, motivic clarity, and long-range structural tension. A waveform shows amplitude, but a spectrogram shows where that amplitude lives across the spectrum and how it changes moment by moment.
I have used spectrograms to compare multiple transfers of early twentieth-century Beethoven discs, modern studio recordings, and live concert captures, and the same lesson returns every time: a spectrogram does not replace musical judgment, but it reveals evidence that subjective listening alone can miss. It can show whether a thunderous opening chord is dominated by low-frequency bloom or upper-mid hammer noise, whether legato is being sustained by finger connection or by pedal blur, and whether a remaster has removed hiss at the cost of suppressing harmonic overtones. For Beethoven, where interpretation often hinges on precision rather than prettiness, those distinctions are musically significant.
The value extends beyond audiophile curiosity. Spectrogram analysis helps answer concrete questions: Why does one pianist sound more percussive in the “Appassionata”? Why does a string quartet make the scherzo of Op. 59 No. 2 feel tighter without actually playing faster? Why do some transfers of Furtwängler’s Beethoven sound airless while others seem vivid despite surface noise? By visualizing transient attacks, overtone stacks, noise floors, and decay tails, spectrograms connect performance decisions to measurable acoustic outcomes. Used carefully, they illuminate how Beethoven’s recorded legacy is shaped by instruments, halls, microphones, formats, and editorial intervention as much as by the notes on the page.
How to read a spectrogram in Beethoven recordings
A spectrogram is most useful when you know what you are looking for. On piano recordings, attacks appear as bright vertical events because a struck note produces a broad burst of energy across partials. Sustained tones then narrow into horizontal bands representing the fundamental and overtones. Dense pedaling creates a thicker cloud between roughly 100 Hz and 4 kHz because sympathetic resonance and blurred decays keep energy active after each attack. On string recordings, bowed notes look different: the onset is less vertical, the sustain is steadier, and vibrato appears as a slight wavering or thickening of the harmonic lines. In orchestral Beethoven, brass entries produce high-energy clusters, while timpani strokes register as low-frequency impacts with clear decay patterns.
Resolution settings matter. A long analysis window gives cleaner frequency separation, which is useful for studying sustained harmony in the slow movement of the Seventh Symphony, but it smears timing details. A short window sharpens attack information, which is better for examining the opening motive of the Fifth Symphony or the left-hand sforzandi in the “Pathétique,” though pitch bands become less defined. Most analysts move between both views. Software such as Sonic Visualiser, iZotope RX, Audacity, and Adobe Audition makes this practical. The point is not to admire colorful plots; it is to align visual evidence with audible events and score-based expectations.
Context also matters because spectrograms display recording chains as much as performances. Shellac discs often show restricted bandwidth, strong noise bands, and mechanical rumble. Mid-century tape may reveal hiss, print-through, or splices. Modern digital recordings often extend beyond 20 kHz in source files, though the musical value of that region is debated. In Beethoven analysis, this means you should avoid attributing every visual difference to interpretive intent. A bright upper spectrum might indicate close microphone placement, not harder articulation. A weak bass floor might reflect transfer filtering, not a conductor avoiding weight in the lower strings.
What spectrograms show about piano touch, pedal, and articulation
Beethoven piano recordings are especially revealing because his writing alternates between hammered rhetoric and vocal legato, often within a few measures. In spectrograms, touch is visible through the shape and intensity of attacks. A pianist with a highly percussive approach produces pronounced vertical transients and stronger upper partial excitation around 2 kHz to 6 kHz. In the opening of the “Appassionata,” this can make repeated bass figures look almost serrated, with each attack clearly isolated. A more rounded touch reduces the brightness of those transients and emphasizes the lower harmonic body, creating a denser but less jagged image. Neither is automatically better; the spectrogram simply clarifies the acoustic result.
Pedaling is even easier to spot. In the “Moonlight” Sonata first movement, generous sustaining pedal creates a continuous mist of residual energy that bridges one harmony into the next. Half-pedal or cleaner changes produce visible gaps where old resonance drops before the new sonority arrives. In fast passagework, overpedaling causes harmonic smearing: adjacent notes leave overlapping trails that obscure rhythmic edges. I often use spectrograms to compare whether apparent legato is genuinely finger-connected or merely sustained by pedal resonance. In Beethoven, that distinction matters because excessive blur can soften motivic definition, especially in works where accents and rests are structural.
The following comparison summarizes what commonly appears when contrasting interpretive choices in Beethoven piano recordings.
| Recording trait | Spectrogram pattern | Likely musical effect |
|---|---|---|
| Crisp staccato | Short bright attacks with rapid decay and visible gaps | Sharper rhythmic profile and clearer motivic separation |
| Heavy sustaining pedal | Persistent energy cloud across lower and middle bands | Richer sonority but greater harmonic blur |
| Harder attack | Stronger vertical transients, more upper partial energy | More brilliance, bite, and perceived urgency |
| Softer legato touch | Less intense onsets, smoother horizontal harmonic bands | More singing line and less percussive emphasis |
| Dry recording acoustic | Brief decays, minimal reverberant tail | High clarity, lower sense of grandeur |
| Reverberant hall | Extended tails and lingering broadband energy | Larger scale, but reduced textural definition |
These patterns become especially useful when comparing editions, instruments, and engineering styles. A fortepiano recording of Op. 111 will often show quicker decay, less sustained bass energy, and more exposed attack noise than a modern concert grand. That is not a defect; it reflects the instrument’s faster speech and lighter frame. Spectrograms help explain why fortepiano textures can make inner voices and registral contrasts in late Beethoven seem startlingly transparent. If you are exploring related score-based analysis, the main guide at https://lvbeethoven.com/how-ai-tools-can-help-analyze-beethoven-scores/ provides useful context for connecting what appears in the notation with what emerges in audio.
How ensemble balance and orchestral texture become visible
In Beethoven symphony recordings, spectrograms reveal balance decisions that standard listening descriptions often blur into general adjectives like warm, lean, heavy, or transparent. A conductor favoring antiphonal violins in the Fifth or Seventh may produce visibly separated upper-mid activity between first and second violin exchanges, especially when the recording perspective preserves stereo localization. In denser tuttis, low brass and timpani reinforce the spectrum below 200 Hz, while woodwind counterlines often emerge as thinner, brighter horizontal traces in the 500 Hz to 3 kHz region. When those traces disappear under string mass, the issue may be orchestral balance, microphone placement, or hall acoustics rather than players failing to project.
Historically informed performances often display cleaner transient definition and less sustained low-frequency accumulation, partly because of lighter vibrato usage, brisk articulation, smaller forces, and reduced reverberant blending. On a spectrogram, scherzo textures can look more ventilated, with clearer space between attacks. By contrast, large mid-century orchestral recordings sometimes show a more continuous blanket of midrange energy, reflecting portamento-rich strings, broader legato, and reverberant venue capture. Again, this is descriptive rather than judgmental. Spectrograms explain why a listener may perceive one Eroica as architecturally transparent and another as monumental.
String quartets are a particularly rich case. In Beethoven’s late quartets, where independent lines cross constantly, spectrograms help track whether inner voices remain acoustically legible. A quartet with highly blended tone may sound beautiful in the room yet produce overlapping harmonic bands that obscure viola material in recorded playback. Another ensemble might emphasize attack and registral spacing, making fugues and canons visually and audibly easier to parse. This is one reason producers scrutinize frequency masking during editing. If two instruments compete in the same band at the same time, even slight microphone or seating adjustments can change the listener’s sense of contrapuntal clarity.
What historic recordings and remasters reveal under spectral analysis
Some of the most striking uses of spectrograms involve historic Beethoven recordings. Early shellac-era sides commonly show a steep roll-off above about 5 kHz, strong surface-noise bands, and intermittent impulsive clicks. Electrical recordings from the late 1920s and 1930s extend higher and capture more dynamic nuance, but they still carry narrow bandwidth compared with modern media. When you compare multiple remasters of the same performance, spectrograms can show exactly what restoration engineers changed. Broadband hiss reduction appears as a dimming of upper-frequency noise, but aggressive settings often erase legitimate overtone energy too, leaving strings and piano sounding papery or shut in.
I have seen this repeatedly in transfers of famous Beethoven performances. One transfer may preserve hiss and turntable rumble yet retain lively harmonic filaments around instrumental attacks. Another may look cleaner on first glance but display spectral holes where musical content should be. De-clicking can also leave signatures: poorly tuned processing removes transient spikes but may blunt percussion and consonant-like instrumental attacks. In piano recordings, excessive noise reduction can flatten the shimmer of upper partials that gives Beethoven’s fortissimo chords their edge. The better restorations usually accept some noise floor in exchange for preserving the musical envelope and overtone structure.
Spectrograms also expose source problems. Off-center pressings create cyclical pitch instability that becomes visible as periodic wavering in harmonic lines. Tape wow and flutter do something similar in later media. Hum at 50 or 60 Hz and its harmonics appears as steady horizontal bands, while mechanical rumble blooms at the bottom of the spectrum. Once you recognize these artifacts, you can separate performance characteristics from medium defects. That is essential when evaluating legendary Beethoven recordings, because reputation can make listeners hear intention where there is only technology.
Limits, best practices, and the most reliable conclusions
Spectrograms are powerful, but they can mislead when treated as self-interpreting proof. Color scales differ by software. Lossy compression can smear high-frequency detail. Microphone technique can mimic interpretive contrast. A close-miked piano will show stronger attack noise than the same performance captured from the hall. Stereo mixes may hide or exaggerate balance depending on phase relationships. For that reason, the best practice is triangulation: compare the spectrogram with careful listening, score study, and knowledge of recording history. If all three point in the same direction, the conclusion is usually solid.
The most reliable conclusions tend to concern attack profile, sustain behavior, spectral balance, noise floor, bandwidth limits, and restoration side effects. More speculative claims, such as deducing emotional character from color density alone, should be avoided. A spectrogram can support the statement that one pianist uses shorter decays and less pedal in the Scherzo of Op. 31 No. 3. It cannot independently prove that the interpretation is more humorous or more classical in spirit. In other words, use the display for evidence, not metaphor. When handled that way, it becomes an unusually precise tool for understanding why Beethoven recordings sound the way they do.
The core benefit is clarity. Spectrograms reveal how touch, pedal, articulation, ensemble balance, room sound, recording format, and restoration choices shape Beethoven on record. They show that differences listeners describe as bite, warmth, transparency, weight, or blur often have concrete spectral signatures. That makes discussion more exact and comparisons more honest, especially across formats and eras. For performers, the tool highlights whether intended accents and textures are really reaching the microphone. For collectors, it distinguishes faithful remastering from cosmetically cleaned but musically diminished transfers. For serious listeners, it deepens attention without reducing art to data.
If you want to hear Beethoven recordings more intelligently, start by pairing one familiar performance with a spectrogram in Sonic Visualiser or Audacity. Follow a single passage, note what changes when the music turns more forceful or more lyrical, and compare that image with another recording of the same bars. The exercise is simple, but the payoff is substantial: you begin to see the acoustic fingerprints of interpretation. That visual evidence will not tell you what to love, but it will tell you more clearly what you are hearing, and in Beethoven, that sharper understanding is worth pursuing.
Frequently Asked Questions
What exactly does a spectrogram show in a Beethoven recording?
A spectrogram turns sound into a visual map, making musical events easier to examine in precise, measurable ways. Time runs from left to right, frequency rises from low to high, and the intensity of the sound is shown through color or brightness. In a Beethoven recording, that means a listener can literally see when a bass line enters, how strongly a chord speaks, how long tones sustain, and where the sound decays into the room. Instead of relying only on verbal impressions such as “brighter,” “heavier,” or “more resonant,” a spectrogram provides evidence for those impressions by showing where energy is concentrated and how it changes over time.
This is especially valuable with Beethoven because his music depends so much on contrast, attack, structure, and dynamic shape. A sharply articulated piano figure will appear differently from a blurred one. A tightly controlled orchestral accent will create a different visual signature than a softer, more blended entrance. Long pedal effects, abrupt silences, dense textures, and registral extremes all become easier to compare when they are visible. In short, a spectrogram does not replace listening, but it adds a second layer of understanding by revealing details that the ear may sense intuitively yet struggle to isolate or quantify.
How can spectrograms reveal performance details like articulation, pedaling, and vibrato in Beethoven interpretations?
Spectrograms are remarkably useful for studying how performers shape Beethoven’s music because they capture fine-grained timing and frequency behavior that directly reflect technique. Articulation, for example, often shows up in the sharpness and spacing of note attacks. A crisp staccato passage tends to produce clear, separated bursts of energy with visible gaps between them, while a more legato or blended approach creates smoother continuity. In piano sonatas, this can help distinguish whether rapid passages are being played with finger clarity, pedal assistance, or a deliberately broader touch. In orchestral or chamber recordings, the same principle can expose whether accents are truly instantaneous or cushioned by ensemble blend and room response.
Pedaling is another area where spectrograms can be revealing. Sustaining pedal increases overlap between notes, reinforces harmonic resonance, and extends upper partials beyond the initial strike. On a spectrogram, that often appears as lingering energy after attacks and increased harmonic clouding in the middle and upper ranges. In Beethoven, where pedaling choices can dramatically affect harmonic tension and texture, this is especially important. A performer using generous pedal in a late sonata may create a richer, more continuous spectral field than one favoring greater separation and transparency.
Vibrato, especially in string playing and singing, can also become visible as slight periodic undulations in frequency over time. This helps analysts compare narrow versus wide vibrato, continuous versus selective usage, and individual versus sectional practice. In Beethoven recordings, these differences can illuminate broader interpretive styles: historically informed performances may show leaner, less constant vibrato, while older symphonic traditions may reveal a more sustained tonal shimmer. Spectrograms therefore offer a practical way to connect interpretive choices to concrete acoustic evidence.
Why are spectrograms useful for comparing historic Beethoven recordings and modern transfers?
Historic Beethoven recordings often exist in multiple transfers, remasterings, and restorations, and spectrograms help make the differences between them much easier to identify. Surface noise, tape hiss, hum, filtering, equalization, noise reduction, and artificial rebalancing all leave visual traces. A shellac-era transfer with minimal intervention may show broad-band noise, crackle events, and limited frequency extension, while a heavily restored version might show cleaner backgrounds but also reduced upper-frequency detail or altered transient definition. These visual clues help explain why one version sounds vivid but noisy, while another sounds smoother yet less natural.
For researchers, collectors, and engineers, this matters because restoration is never neutral. Every transfer involves choices about what to preserve and what to suppress. Spectrograms can reveal whether noise reduction has stripped away harmonics along with hiss, whether low-frequency rumble has been properly controlled, or whether aggressive filtering has dulled instrumental presence. In Beethoven performances of historical importance, such as landmark sonata cycles or early symphonic recordings, these details affect not just sonic beauty but also interpretive understanding. If a restoration softens attacks or compresses resonance, it may subtly reshape how the performance is perceived.
Comparing spectrograms across versions gives a more objective basis for discussion. Rather than saying one transfer sounds “more open” or “more processed,” analysts can point to retained overtone content, visible transient edges, or frequency bands that have been attenuated. That makes spectrograms a powerful tool for evaluating how faithfully modern transfers represent historic Beethoven recordings.
Can a spectrogram show the acoustic environment or recording technology behind a Beethoven performance?
Yes. One of the most revealing uses of a spectrogram is its ability to expose the signature of the recording space and the technology used to capture it. Room acoustics often appear in the way sound decays after notes and chords. A dry studio environment produces relatively quick falloff, while a resonant hall creates longer tails and more diffuse energy extending after the initial event. In Beethoven, where dramatic pauses, orchestral tuttis, and sustained piano sonorities are structurally significant, the acoustic profile can strongly influence the listener’s experience. A spectrogram can make those reverberation patterns easier to compare across venues and recordings.
Microphone placement and recording format also leave fingerprints. A close-miked piano recording may show highly defined attacks and less ambient bloom, while a more distant setup may produce softer transients and more visible room energy around them. Older recording technologies may exhibit narrower bandwidth, stronger noise floors, saturation effects, or uneven frequency response. Early tape recordings can show hiss and occasional print-through characteristics, while even earlier disc recordings may display abrupt frequency limits and mechanical noise artifacts.
These factors are not just technical trivia. They shape how Beethoven’s music is heard and judged. A broad, reverberant acoustic can make orchestral grandeur feel more monumental but may blur inner detail. A dry recording can clarify counterpoint while reducing perceived scale. Spectrograms help separate what belongs to the performer from what belongs to the room, microphone chain, or medium itself. That distinction is invaluable when analyzing recorded interpretations across eras.
Do spectrograms replace careful listening when analyzing Beethoven recordings?
No. Spectrograms are best understood as a complement to listening, not a substitute for it. They are excellent at exposing measurable patterns: timing, frequency content, overtone distribution, transient behavior, resonance, and noise. But Beethoven interpretation also involves elements that remain partly aesthetic and contextual, such as tension, phrasing, rhetoric, emotional pacing, and stylistic intent. A spectrogram can show that a chord was sustained longer, that upper harmonics were stronger, or that a crescendo accumulated energy across a certain range, but it cannot by itself decide whether those choices were persuasive, moving, or musically appropriate.
What spectrograms do exceptionally well is sharpen perception. They help listeners test assumptions, confirm suspicions, and notice details that might otherwise pass too quickly to examine. If two recordings of the same movement feel different, the spectrogram can help explain why. Perhaps one has more low-frequency weight, cleaner articulation, longer pedal resonance, or more audible hall decay. Those findings enrich the listening experience by linking subjective reaction to observable sound behavior.
For Beethoven in particular, this combination of ear and eye is powerful. His music rewards close attention to structure, attack, silence, contrast, and sonority. Spectrograms make those dimensions visible, but listening remains the final judge of meaning. The most insightful analysis uses both: the ear for musical significance, and the spectrogram for acoustic evidence.