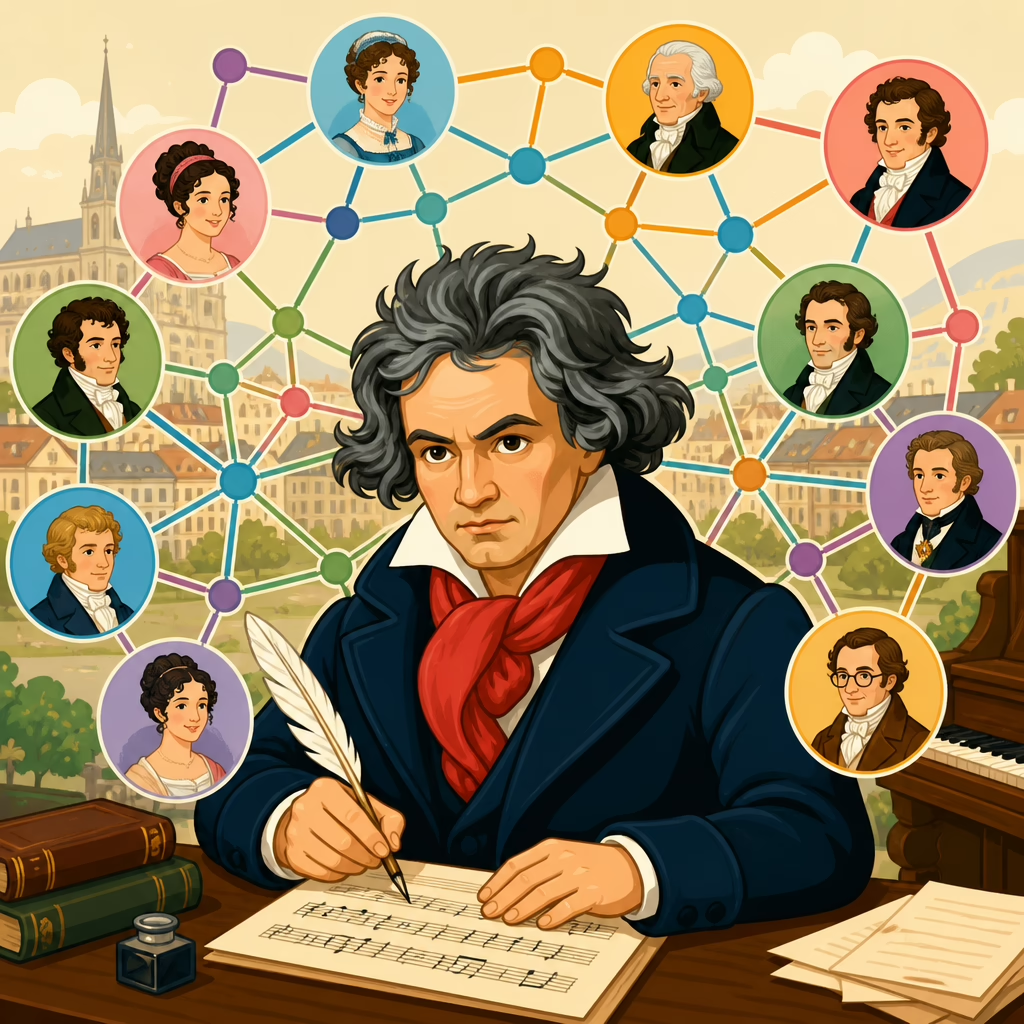
Using Network Graphs to Trace Beethoven’s Circle
Using network graphs to trace Beethoven’s circle turns a familiar biographical story into a measurable system of relationships. A network graph is a visual model made of nodes and edges: nodes represent people, places, works, publishers, patrons, or events, while edges represent ties such as letters sent, lessons given, payments recorded, premieres attended, or dedications exchanged. In Beethoven studies, this method helps scholars move beyond anecdote. Instead of saying Beethoven knew many aristocrats, copyists, and performers, a graph can show exactly which figures connected him to Vienna’s publishing market, which patrons introduced him to salons, and which collaborators remained central across different periods of his life. That precision matters because Beethoven’s career depended on social infrastructure as much as genius. His access to commissions, legal protection, concert opportunities, manuscript circulation, and reputational influence all flowed through relationships that can be traced, compared, and tested.
I have used network analysis on music-historical datasets, and the immediate benefit is clarity. Letters, diary entries, subscription lists, conversation books, court documents, and edition records contain hundreds of names that are hard to hold in mind at once. A graph organizes them into a structure that reveals clusters, bridges, and outliers. For Beethoven, that means we can distinguish inner-circle intimates from occasional correspondents, identify the intermediaries who linked him to publishers in Leipzig or London, and see how his network changed after hearing loss altered his methods of communication. This approach is especially useful when sources are fragmentary. Even incomplete evidence can show repeated interactions, and repeated interactions often matter more than a single famous meeting. Network graphs therefore support a practical question at the center of Beethoven research: who made things happen around him, and how did those channels shape the music’s creation, performance, and survival?
What a Beethoven network graph actually maps
A useful Beethoven network graph begins with a narrow research question. If the goal is to trace his circle, the best starting point is a person-to-person network centered on Beethoven, then expanded to include institutions and works only when they explain a relationship. Core nodes typically include patrons such as Archduke Rudolph, Prince Lichnowsky, Prince Lobkowitz, and Count Razumovsky; publishers including Artaria, Breitkopf & Härtel, and Steiner; performers such as Ignaz Schuppanzigh; assistants, copyists, and secretaries like Anton Schindler, with caution; family members including Kaspar Karl van Beethoven; and later advocates such as Ferdinand Ries and Carl Czerny. Edges can be coded by type: correspondence, financial support, performance collaboration, teaching, legal conflict, friendship, editorial intervention, or dedication. A weighted edge records intensity, such as the number of surviving letters or the size of documented payments.
The distinction between direct and indirect ties is critical. Beethoven may never have met every subscriber, critic, or admirer linked to his work, yet those figures entered his operational network through publishers, patrons, and performers. In practical analysis, I usually separate ego networks from two-step networks. The ego network includes direct contacts around Beethoven himself. The two-step network includes the contacts of those contacts, revealing how influence traveled outward. For example, Schuppanzigh was not merely a violinist in Beethoven’s orbit; he was a bridge into performance circles that affected the reception of the string quartets. Similarly, Archduke Rudolph was not simply a dedicatee but part of a stabilizing patronage structure that buffered Beethoven financially and socially. When the graph is built carefully, centrality measures make these distinctions visible rather than impressionistic.
Sources, data modeling, and historical caution
The strongest graphs come from disciplined source work, not software tricks. Beethoven researchers commonly draw from the published correspondence, conversation books, thematic catalogues, memoir literature, subscription records, first-edition imprints, and archival payment documents. The challenge is entity resolution: one person may appear under multiple spellings, titles, or languages. Prince Lichnowsky, for instance, may appear as Karl Lichnowsky, Fürst Lichnowsky, or in abbreviated form. Unless names are normalized, the graph fragments one historical actor into several false nodes. Dates also require care. A tie based on a reminiscence written decades later should not be treated as equal to a dated letter or contract. In my own workflow, every edge gets a source citation, date range, and confidence score so later interpretation remains auditable.
Historical caution is especially important with colorful but unreliable witnesses. Anton Schindler looms large in Beethoven biography, yet his testimony is notorious for exaggeration and tampering. A graph that mechanically ingests every Schindler claim will distort the network, inflating his centrality and manufacturing ties. Better practice is to preserve disputed edges as a separate layer or assign them lower confidence. The same principle applies to silence in the archive. Missing evidence does not prove missing contact; it only means contact is undocumented. That is why network graphs should be read as models of surviving evidence, not total maps of lived reality. Used responsibly, they sharpen judgment. Used carelessly, they give a false aura of mathematical certainty to weak historical claims.
How graph metrics reveal Beethoven’s inner and outer circles
Once the data is structured, network metrics answer questions biographers often frame loosely. Degree centrality shows how many direct connections a node has. In Beethoven’s circle, high degree often identifies prolific correspondents, active intermediaries, or figures involved in several aspects of his career at once. Betweenness centrality is even more revealing because it identifies brokers positioned on the shortest paths between others. A person with moderate fame can prove structurally indispensable if they connected Beethoven to otherwise separate groups, such as publishers in different cities or salon networks beyond Vienna. Closeness centrality helps estimate how quickly information could move from one node to the rest of the network, while community detection can uncover clusters such as aristocratic patronage, publishing commerce, domestic family conflict, or professional performance circles.
These metrics become meaningful when paired with historical interpretation. Archduke Rudolph often appears as a durable high-value tie because his relationship with Beethoven combined patronage, instruction, symbolic prestige, and long-term loyalty. Prince Lobkowitz may emerge strongly in periods tied to performance support and the private circulation of major works. Schuppanzigh can rank highly as a broker in quartet culture, especially when performance events are included. Ferdinand Ries may not match aristocratic patrons in wealth, but he matters as a transmitter of information and reputation across regions. By contrast, a celebrity node may have lower structural importance than expected if the documented ties are occasional or ceremonial. Metrics do not replace reading letters and contracts. They tell you where to look harder and which assumptions deserve revision.
| Metric | What it shows | Beethoven example |
|---|---|---|
| Degree centrality | Number of direct ties | Highlights frequent correspondents and recurring collaborators |
| Betweenness centrality | Brokerage between groups | Shows figures linking Beethoven to publishers or performers in separate circles |
| Closeness centrality | Average distance to other nodes | Indicates who could spread news or opportunities quickly |
| Community detection | Cluster membership | Separates patronage, family, publishing, and performance sub-networks |
| Edge weight | Strength or frequency of ties | Distinguishes long-term patrons from one-time contacts |
Patterns that emerge across Beethoven’s career
One of the clearest advantages of network graphs is the ability to compare time slices. Beethoven’s circle in the 1790s, when he was establishing himself in Vienna, looks different from his circle in the middle period and different again from the late years shaped by deafness, legal strain, and increasing dependence on written communication. In early Vienna, graphs tend to show dense ties to noble patrons, teachers, and salon intermediaries who gave him legitimacy and access. During the heroic middle period, the network often widens around publishers, performers, and institutions that carried ambitious works into broader circulation. In the late period, some ties thin out while others intensify, especially around copyists, confidants, family disputes, and the management of manuscripts, performances, and publication negotiations.
Temporal analysis also helps explain artistic transitions without reducing them to psychology alone. When Beethoven’s social and economic support shifted, his working conditions changed with it. The annuity agreement of 1809 involving Archduke Rudolph, Prince Kinsky, and Prince Lobkowitz is a classic example: it was not merely a financial event but a structural reinforcement of his autonomy within the network. Likewise, the rise of conversation-book communication altered the documentary visibility of certain associates, making some later ties easier to capture than earlier verbal interactions. A time-aware graph can therefore distinguish genuine social change from archival bias. This is where digital methods are particularly strong: they let researchers compare periods consistently rather than relying on selective memory from famous episodes.
Tools and workflow for building the graph
For most Beethoven projects, a practical workflow begins in a spreadsheet or relational database before moving into Gephi, Cytoscape, Palladio, or Python libraries such as NetworkX. Each row should represent one relationship instance or one normalized edge, depending on the research design. Essential fields include source, date, person A, person B, relationship type, weight, location, and confidence. If the project tracks institutions or works as nodes, include a node-type field so visualizations can separate people from organizations and compositions. I recommend controlled vocabularies from the start. Terms like “patron,” “publisher,” “copyist,” and “student” should be standardized, because inconsistent labels create analytical noise later. For larger datasets, OpenRefine is excellent for cleaning names and reconciling duplicates.
Visualization choices matter because bad design can hide the very patterns the graph is supposed to reveal. Use node size for a single metric, usually degree or betweenness, and edge thickness for tie weight. Color should identify communities or relationship categories, not decorative themes. Force-directed layouts are common, but they should not be treated as neutral truth; layout algorithms can exaggerate or minimize perceived proximity. Always accompany a graph with a methodological note stating what counts as a tie and what period the image covers. For readers exploring related digital methods, the broader guide on how AI tools can help analyze Beethoven scores provides useful context for connecting social-network evidence with score-based analysis, though the network graph remains a distinct historical tool rather than a substitute for musical study.
What network graphs can and cannot prove
Network graphs are powerful because they reveal structure, but they do not prove motive, affection, or artistic causation on their own. A thick edge between Beethoven and a publisher shows repeated documented interaction; it does not automatically show trust, satisfaction, or creative influence. A central node may be central because the archive preserves that person’s papers unusually well. Conversely, an apparently peripheral figure may have mattered deeply in undocumented conversation or domestic routine. In Beethoven’s case, where hearing loss, mobility, class dynamics, and family tensions all affected communication, social meaning rarely maps perfectly onto surviving traces. The graph should therefore be used as an argument aid: it identifies relationships worth explaining, anomalies worth investigating, and patterns too large for narrative intuition alone.
That limitation is not a weakness but a guardrail. The best Beethoven network studies combine quantitative mapping with close reading of letters, publication histories, and performance contexts. When the two approaches converge, conclusions become stronger. If a broker node ranks high in betweenness and also appears repeatedly in negotiations across cities, the case for that person’s influence is robust. If a supposed intimate ranks low and lacks corroborating documentary depth, the familiar story may need trimming. Using network graphs to trace Beethoven’s circle ultimately gives researchers, students, and serious listeners a sharper picture of how musical life functioned around him. Build the dataset carefully, annotate every edge, test the graph across time, and let the patterns challenge inherited assumptions. That is how a celebrated life becomes legible as a working network, and how better questions lead to better Beethoven history.
Frequently Asked Questions
What does it mean to use network graphs to trace Beethoven’s circle?
Using network graphs to trace Beethoven’s circle means turning a broad, often anecdotal account of his life into a structured map of relationships that can be studied visually and quantitatively. In a network graph, each node stands for an entity such as Beethoven himself, a patron, student, publisher, copyist, venue, composition, or city. The edges between those nodes represent documented connections, including letters exchanged, payments made, commissions arranged, lessons taught, premieres attended, dedications offered, or introductions brokered. Instead of relying only on narrative statements such as “Beethoven moved in influential circles,” scholars can identify exactly who was connected to whom, how frequently, and through what kinds of interactions.
This approach is especially useful because Beethoven’s life involved overlapping social, artistic, and professional networks rather than a single stable inner circle. A graph can show, for example, the difference between close long-term allies, occasional correspondents, elite patrons, business intermediaries, and people linked to one major performance or publication. It can also reveal whether certain figures acted as bridges between communities, such as connecting Beethoven to publishers in another city or introducing him to aristocratic households. In that sense, a network graph does not replace traditional biography; it sharpens it by making patterns visible that are otherwise difficult to track across thousands of documents and events.
Why are network graphs useful for Beethoven research compared with traditional biography alone?
Traditional biography remains essential for understanding Beethoven’s personality, artistic development, and historical context, but network graphs add a level of analytical precision that biography alone often cannot provide. A written life story tends to emphasize major episodes and memorable personalities, which can unintentionally flatten the complexity of social reality. Network analysis helps scholars test assumptions about influence, access, reputation, and collaboration by looking at the full structure of documented relationships rather than only the most famous examples. It becomes possible to compare central figures, peripheral figures, and short-lived connections in a systematic way.
For instance, a person who appears only briefly in a standard biography may prove highly significant in a network graph if they linked Beethoven to several otherwise disconnected circles, such as the worlds of performance, patronage, and publishing. Likewise, someone celebrated in anecdotal literature may appear less central when the documented record is mapped carefully. Network graphs also allow researchers to measure changes over time. Beethoven’s contacts in Bonn differed from those in early Vienna, and both differed again from the dense professional and aristocratic networks of his mature career. By modeling those shifts, scholars can study how opportunities emerged, how support systems changed, and how artistic production was embedded in a broader social infrastructure. In short, network graphs make Beethoven’s environment more measurable without stripping away historical nuance.
What kinds of sources are used to build a network graph of Beethoven’s relationships?
A reliable network graph depends on strong documentary foundations, and Beethoven research offers a rich range of sources for this work. Letters are among the most obvious materials because they record direct contact between Beethoven and friends, patrons, publishers, family members, performers, and officials. Account books, payment records, subscription lists, court documents, diaries, memoirs, conversation books, concert programs, publication notices, dedication pages, and archival records from theaters or noble households can also supply evidence of connection. Even a manuscript’s transmission history can matter if it reveals who copied, owned, performed, sold, or preserved a work.
The key point is that not every edge in a graph has to mean the same thing. One connection may represent a personal friendship, another a financial transaction, another a pedagogical relationship, and another a public event attended by multiple people. Good scholarship distinguishes among these ties rather than treating all contacts as equal. Researchers often annotate each edge with attributes such as date, location, direction, intensity, and source citation. That allows the graph to reflect the documentary record more honestly. If a scholar knows that Beethoven sent a letter to a publisher in Leipzig on a certain date, that tie can be marked differently from a presumed acquaintance mentioned decades later in a memoir. The quality of the graph therefore depends not just on collecting many names, but on defining relationships carefully and grounding them in verifiable evidence.
What can a network graph reveal about Beethoven’s world that might otherwise be missed?
One of the greatest strengths of network analysis is its ability to reveal hidden structure. A network graph can show clusters of activity around patrons, publishers, salons, courts, or performance venues, making it easier to see how Beethoven’s career depended on interconnected systems rather than isolated genius. It may identify central brokers who helped move music, money, information, or reputation across social boundaries. It can also highlight moments when Beethoven’s network expanded rapidly, contracted during periods of crisis, or shifted geographically in response to political and cultural change.
For example, a graph might show that a seemingly minor intermediary had disproportionate importance because they connected Beethoven to several patrons and publishers at once. It might reveal that dedications were not merely ceremonial gestures but part of a strategic relationship network tied to support, prestige, and circulation. It can also clarify the social life of specific works by linking compositions to commissioners, first performers, copyists, premiere venues, and early audiences. Rather than asking only who Beethoven knew, researchers can ask deeper questions: which relationships generated opportunities, which ones stabilized his finances, which communities supported particular genres, and which figures connected private aristocratic spaces to public musical culture. These are the kinds of insights that become much easier to see when relationships are modeled as a system.
Are there limits or risks in using network graphs to study Beethoven’s circle?
Yes, and responsible scholars take those limits seriously. A network graph can look precise and objective, but it is always shaped by choices about what counts as a node, what counts as a tie, how strong a connection should appear, and which dates or documents are considered reliable. Surviving evidence is uneven. Some people left extensive correspondence and records, while others appear only indirectly or not at all. That means the graph reflects both Beethoven’s historical world and the archive’s gaps. Silence in the record does not necessarily mean absence in reality.
Another risk is oversimplification. Human relationships are layered, ambiguous, and change over time. A single line between two nodes may compress years of conflict, intimacy, negotiation, or dependency into one visual mark. To avoid misleading conclusions, network graphs should be read alongside close historical interpretation, not as substitutes for it. Time-sensitive modeling is especially important in Beethoven studies because relationships evolved across different cities, phases of career, and political conditions. A static graph can hide those developments if used carelessly. The best use of network analysis is therefore balanced and critical: it helps scholars identify patterns, test claims, and ask new questions, while traditional historical methods provide the context needed to interpret what the graph actually means.